Lab · Project
Measuring Share of Voice in AI answers yourself
$30 to $35 self-run · €85 Peec Starter · July 2026 price snapshot
Positioning: This monitor is an open DIY and workflow reference for running your own self-configured prompt set. It is not the public DACH benchmark. The fixed-panel research, its methodology and its data boundaries live separately under Research.
Starting point: you get the score, not the formula
On client projects I measure AI visibility with Peec.ai. It delivers daily prompt-level data, and for day-to-day work that is the right choice. One thing it does not deliver: the arithmetic behind the number.
For a brand that puts “no assumptions without a data basis” on its homepage, that gap is a problem waiting to happen. When I explain to a client why their Share of Voice fell from 18 to 11 percent, I want to trace the chain back to the raw answer. So I built the measurement myself, end to end – as a tool for client work and as a test of my own method.
What the workflow does
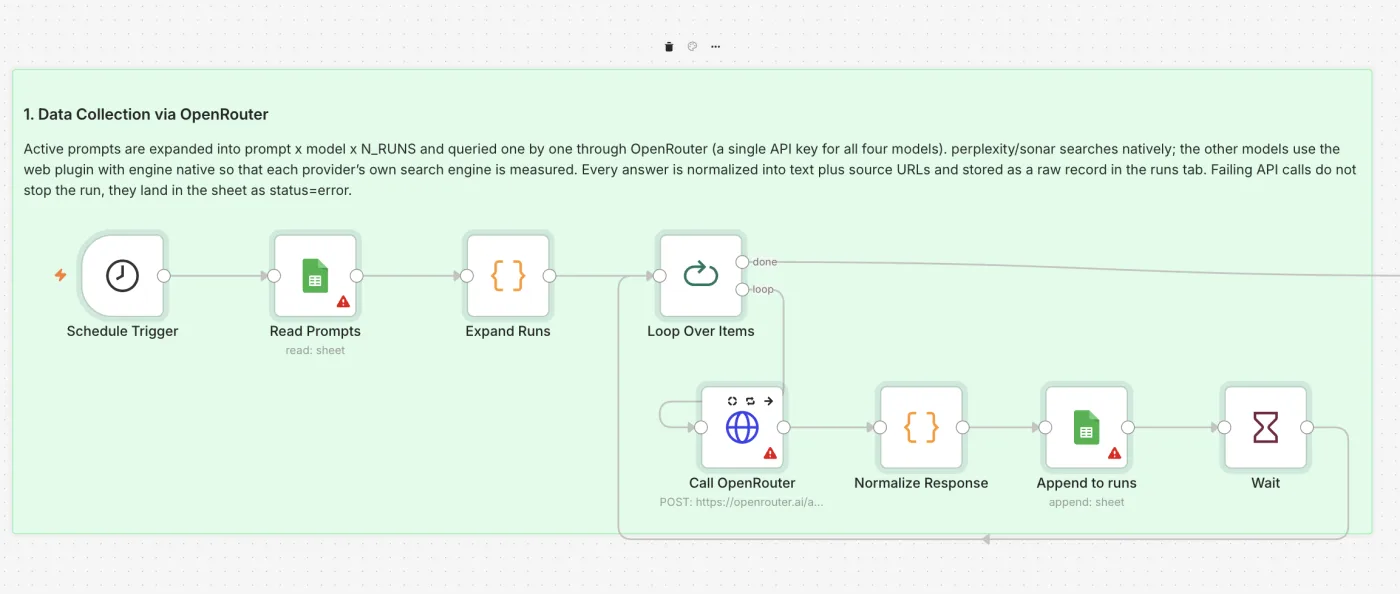
Four phases, fired by a schedule. Phase one expands every active prompt into prompt × model × repetition and sends each call through a single OpenRouter account. Perplexity Sonar searches natively; the other models get the web plugin with engine: native, so each provider is measured with its own search engine rather than someone else’s bolted in front. Every answer lands in Google Sheets as a raw record with full text and source URLs. Failing calls do not abort the run, they sit in the sheet as status=error.
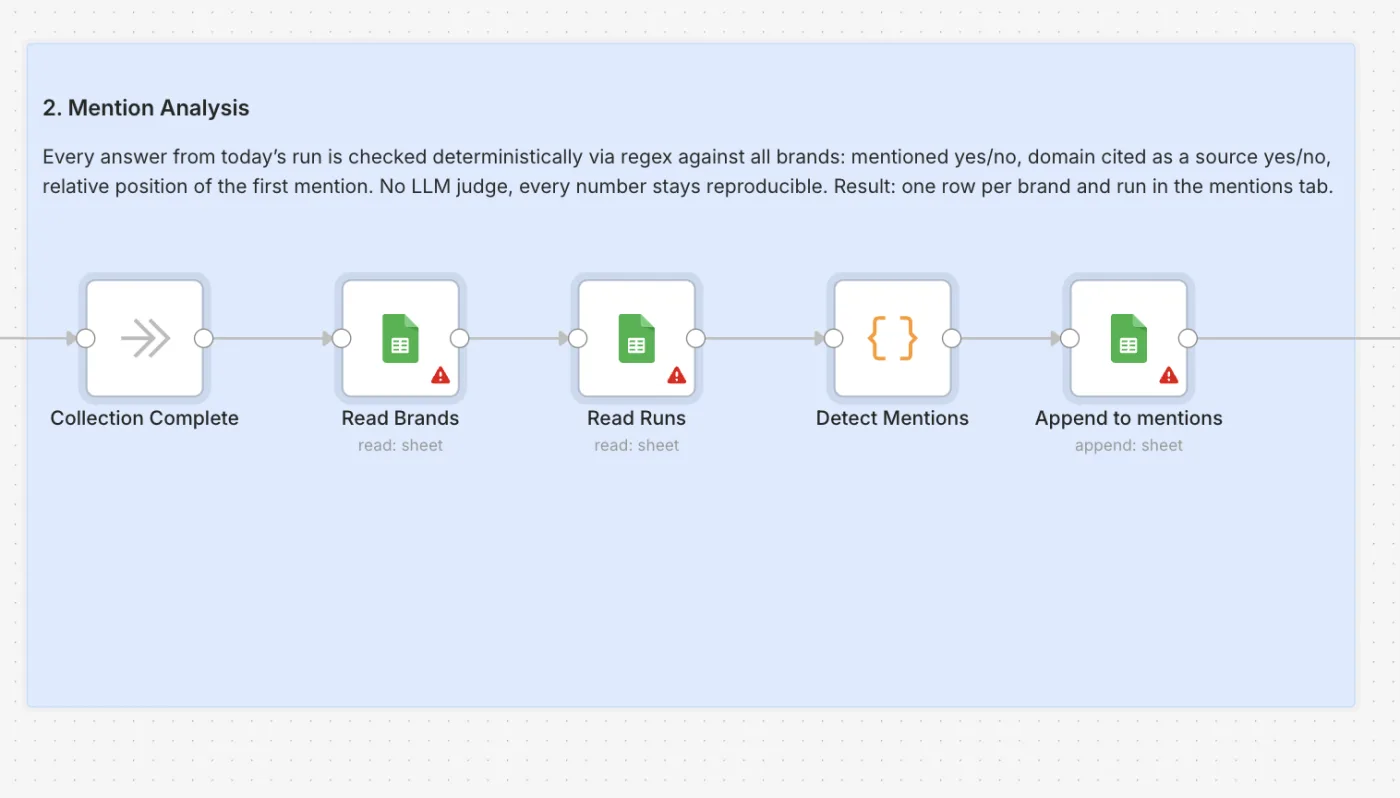
Phase two checks every answer against the brand list: mentioned yes/no, domain cited as a source yes/no, relative position of the first mention. This runs on regex, not on an LLM judge. That difference decides whether the whole time series is usable: a model grading another model returns slightly different numbers on every pass, and once you can no longer separate the judge model’s mood from real market movement, you are measuring yourself. Regex returns the same number for the same input. Reproducibility beats elegance.
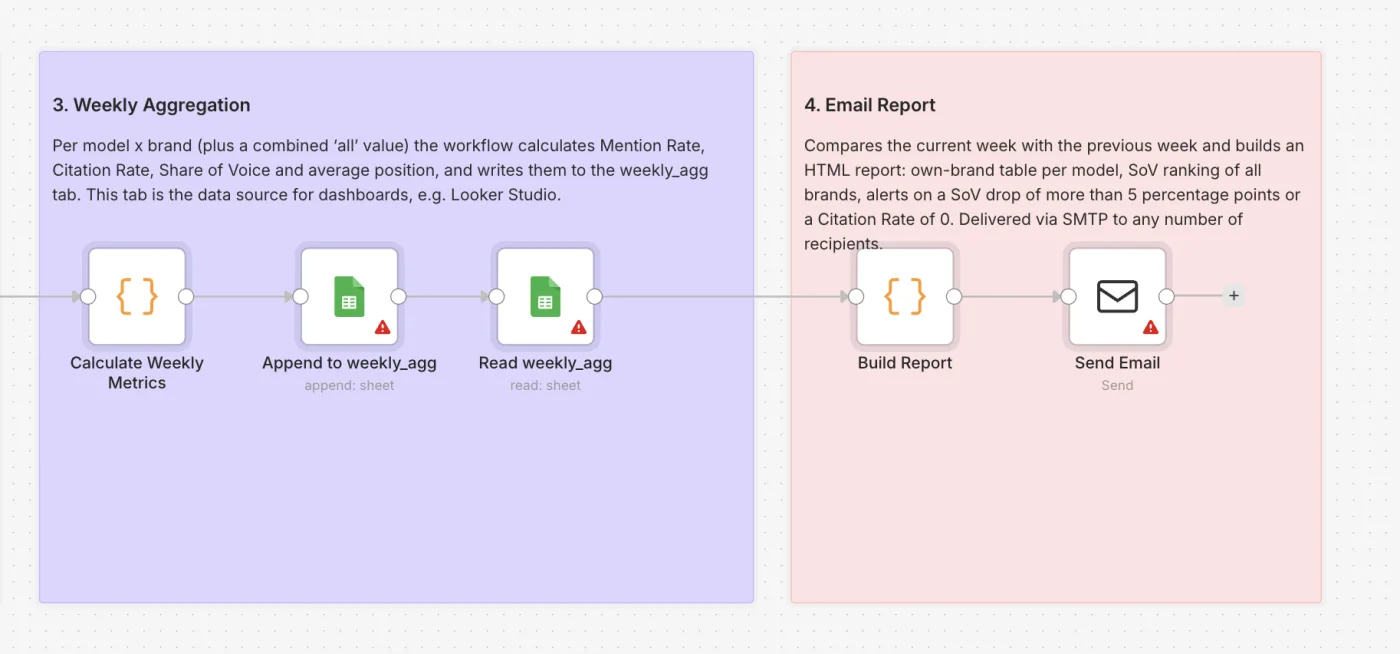
Phase three aggregates per model and brand into weekly figures – mention rate, citation rate, Share of Voice, average position – plus a combined value across all models. Phase four compares against the previous week and sends an HTML report with deltas in percentage points. Two alerts are built in: a SoV loss of more than five percentage points, and a citation rate dropping to zero. The second alert is diagnostic, but not conclusive: blocked crawlers, model or prompt changes, API failures or a broken parser can all produce it. I check raw answers, source URLs and error status first.
Every prompt runs three times per model. Repetition reduces the influence of one stochastic answer; a defensible trend still requires several measurement dates.
Data model
Google Sheet
├── prompts      question, topic, market, language, active
├── brands       name, aliases_regex, domains, is_own
├── runs         raw answer + source URLs, one record per call
├── mentions     one row per brand per answer
└── weekly_agg   weekly figures, data source for Looker Studio
Five tabs, no server, no database. The sheet is configuration, raw storage and export format at once. Brand and metric logic stays inside it: only the questions themselves go to the model APIs, never the competitor list.
What it costs to run
In the measured run, model tokens were the smallest line item at around $2 a month. Most of the cost came from search: Perplexity charged a request fee, while GPT and Gemini added the web search plugin. The figures below come from 50 prompts across three models (GPT-4o-mini, Gemini 2.5 Flash, Perplexity Sonar), as of July 2026. The workflow also supports Claude; that fourth route is not included in the cost table.
| Operating mode | Cost per month |
|---|---|
| Weekly, 1 run | $10 to $12 |
| Weekly, 3 runs | $30 to $35 |
| Daily, 1 run | $70 to $80 |
| Daily, 3 runs | $200 to $220 |
In the July 2026 price snapshot, hosting added a small VPS from about $5 or n8n Cloud from around €24 a month.
The honest comparison
This is where it gets uncomfortable, which is exactly why it belongs on this page. Peec.ai and orchly.ai measure daily. The self-build is cheaper only as long as a weekly cadence will do.
In my account in July 2026, Peec’s Starter plan cost €85 a month and covered a comparable core scope: 50 prompts, three models and one project, but daily instead of weekly and with a dashboard, sentiment and source analysis. Orchly Essential sits at $49 monthly ($37 billed annually) for 25 daily-refreshed prompts, with ChatGPT, Google AI Overview and Perplexity in the base plan; Gemini, Claude, Grok and AI Mode cost extra.
Scale the self-build up to daily measurement with three runs and it lands at $200 to $220, more expensive than either – with no ready-made dashboard, no sentiment analysis, no support. If you need daily data and a team front end, buy the product. That is not a concession, that is the math.
Two things still belong to the self-build. First, model choice: Claude Sonnet arrives only in Peec’s Enterprise plan, and a fourth model adds €35 on Starter. In the workflow it is an entry in an array. Second, prompt volume: 50, 200 or 500 prompts change no license, only the API bill.
Data sovereignty, not data protection
Self-build projects often come with the line “your data stays with you”. It does not hold up here, and I would rather say so myself. The preconfigured prompt set contains no personal data. Model answers and source text may nevertheless contain names or other personal information, so this architecture does not establish a privacy advantage. The self-build sends requests to more US providers, not fewer: OpenRouter, OpenAI, Google, Perplexity. The raw data sits in Google Sheets. Anyone constructing a privacy advantage over a German SaaS from that is arguing against their own architecture.
What does hold up is sovereignty over the data. The full answer texts belong to you, exportable, with no vendor lock-in. Every Share of Voice number can be recalculated, because the formula sits in the code node and detection runs deterministically. And the most strategically sensitive asset, the tracked prompt set with its competitor list, lives in your spreadsheet instead of a vendor’s database.
Where it trips you up
Source URLs come back in different places depending on the model. The workflow reads annotations[].url_citation.url first, the OpenRouter standard, and falls back to Perplexity’s older citations field. Without that fallback the citation rate sits silently at zero and looks like a crawler problem.
The brand regex decides your data quality. A brand carrying a common-word name will, without word boundaries and a maintained alias list, collect hits in answers that are about something else entirely, and Share of Voice climbs while nothing real has happened. Test your expressions against ten actual answers before you arm the schedule.
Then the patience test: in my runs so far, four to six weeks was the minimum before the time series showed more than fluctuation. That is a practical observation, not a statistically validated threshold.
Effort
Zero to production: about five working days for data model, API integration, parsing, aggregation and report. Importing the finished workflow takes two to four hours for credentials, the Google Sheet and a test run.
It started with the question whether I can trace the number I show a client back to the raw answer. Now I can – and so can you: the workflow is a template in the official n8n library, it lives on GitHub, and it is available as JSON to import, CC BY 4.0. Import it, create a sheet, activate five prompts, wait a week. If you then want to know what those numbers mean for your brand: write to me.